Farm and ranch statistics and photos from 100 years ago
The statistics below are quoted from
World Geographies: Second Book, Kentucky Edition (pp. 202-206) by Ralph S. Tarr and Frank M. McMurry, published in New York by the MacMillan Company in 1922.
I scanned the photos in this post from the same old book. I hoped to find photos that complemented the statistics, but no photos were available for some categories, such as hogs, horses, and hay. I finally decided to just scan some of the most interesting pictures of agriculture, whether or not they are related to the numbers. It's impossible to know when the photos were taken, but it seems likely that they were more up-to-date at the time of publishing than the statistics were.
We don't properly appreciate the availability of statistics that we enjoy today. Imagine -- when the authors were writing this book, around 1920, they used farm statistics from a full decade earlier. If newer numbers had been available, surely the publisher would have insisted on an update!
| The six leading corn-producing states in 1910 |
|---|
| Bushels produced | Value |
| Illinois | 414,812,000 | $157,629,000 |
| Iowa | 343,870,000 | $123,793,000 |
| Missouri | 273,900,000 | $120,516,000 |
| Texas | 181,280,000 | $114,206,000 |
| Indiana | 201,216,000 | $201,216,000 |
| Kansas | 169,100,000 | $169,100,000 |
(Corn photos from two different sections of the book.
The main reason that the corn grew tall in favorable
conditions was that the gene for tall corn popped up
frequently in the open-pollinated corn of that era.)
| The six leading wheat-producing states in 1910 |
|---|
| Bushels produced | Value |
| Minnesota | 94,080,000 | $88,435,000 |
| Kansas | 62,068,000 | $52,137,000 |
| South Dakota | 46,720,000 | $41,581,000 |
| Indiana | 40,981,000 | $35,653,000 |
| North Dakota | 36,105,000 | $32,494,000 |
| Nebraska | 35,124,000 | $31,612,000 |
| The six leading cotton-producing states in 1910 |
|---|
| 500-lb. bales produced |
| Texas | 3,140,000 |
| Georgia | 1,750,000 |
| Alabama | 1,174,000 |
| Mississippi | 1,160,000 |
| South Carolina | 1,116,000 |
| Oklahoma | 900,000 |
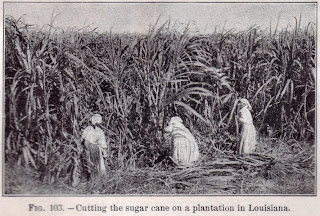
| The six leading sugar-producing sections in the U.S. and its dependencies in 1910. (Colorado, beet sugar; all others, cane sugar) |
|---|
| Long tons produced |
| Colorado | 1,122,117 |
| Hawaii | 485,000 |
| Porto Rico [sic] | 320,000 |
| Louisiana | 300,000 |
| Philippines | 150,000 |
| Texas | 11,000 |
| The six leading hay-producing states in 1910 |
|---|
| Tons produced | Value |
| New York | 6,351,000 | $87,009,000 |
| Pennsylvania | 4,443,000 | $66,495,000 |
| Ohio | 3,948,000 | $49,350,000 |
| Michigan | 3,370,000 | $45,832,000 |
| Illinois | 3,717,000 | $44,604,000 |
| Iowa | 3,780,000 | $36,288,000 |
| |
| The six leading hog-producing states in 1910 |
|---|
| Number produced | Value | |
| Iowa | 7,527,153 | $69,535,997 |
| Illinois | 4,683,577 | $36,182,639 |
| Missouri | 4,429,429 | $31,878,568 |
| Nebraska | 3,434,938 | $29,642,092 |
| Kansas | 2,997,319 | $24,681,180 |
| Indiana | 3,619,906 | $23,739,586 |
| The six leading milk-producing states in 1910. (Based on statistics giving number of dairy cows and production per cow.) |
|---|
| Gallons produced |
| New York | 783,479,286 |
| Wisconsin | 667,497,765 |
| Iowa | 489,563,616 |
| Pennsylvania | 411,735,240 |
| Minnesota | 407,020,500 |
| Illinois | 395,934,071 |
| The six leading cattle-producing states in 1910 |
|---|
| State | Cattle produced | Value |
| Texas | 6,721,502 | $129,130,917 |
| Iowa | 4,638,422 | $118,991,384 |
| New York | 2,421,593 | $83,015,622 |
| Kansas | 3,066,337 | $80,184,162 |
| Nebraska | 2,931,255 | $73,048,897 |
| Missouri | 2,556,420 | $72,731,694 |
| The six leading sheep-producing states in 1910 |
|---|
| State | Sheep produced | Value |
| Wyoming | 5,394,959 | $29,648,616 |
| Montana | 5,372,639 | $28,999,239 |
| Idaho | 2,950,534 | $15,631,797 |
| Ohio | 3,907,055 | $14,932,790 |
| Oregon | 2,696,779 | $12,197,477 |
| New Mexico | 3,264,012 | $11,905,380 |
This image was posted previously with
a
description of sheep raising in 1920.
| The six leading horse-producing states in 1910 |
|---|
| State | Horses produced | Value |
| Iowa | 1,489,225 | $177,658,734 |
| Illinois | 1,450,406 | $163,062,351 |
| Missouri | 1,070,913 | $113,707,841 |
| Kansas | 1,144,870 | $112,543,535 |
| Nebraska | 1,006,550 | $102,706,582 |
| Ohio | 910,271 | $98,853,108 |


No comments:
Post a Comment